
Sample and Procedure
In October 2019, the CQ-i online assessment dataset collected online since 2014 (n = 2,471) was exported from the online assessment platform at www.consciousness-quotient.com. During data collection, no financial gratification was offered to participants for filling the questionnaire, and the order of questions was fixed for each participant. All the participants completed the CQ-i assessment in the English language.
After discarding possible invalid answers, a dataset of 2,360 entries was used in the EFA procedure. After the EFA procedure and following a decision to tighten the inconsistency filters (using 5 pairs of two semantically consistent items in each pair), 94 entries were further removed; thus, a dataset of 2,266 entries was used for norming and score classification. All data analyses were performed with SPSS (IBM, Armonk, NY, USA) and Jamovi (Open Source Project, www.jamovi.org).
The primary socio-demographic data are described below (n = 2,266; M = 36.35 years; SD = 12.49 years; age range = 82 years, ages 18–100 years old):
- Age intervals (years): 18–19, 5%; 20–29, 29.1%; 30–39, 30.5%; 40–49, 20.2%; 50–59, 10.2%; 60–69, 3.7%; ≥ 70, 1.3%;
- Sex: women, 63.7%; men, 36.3%;
- Countries: 96 (Romania, 46.5%; USA, 18.3%; India, 5.6%; Great Britain, 4.9%; Australia, 2.8%; Canada, 2.3%; Mexico, 2.3%; South Africa, 1.8%; and 15.6% from 88 other countries);
- Highest education: college/university, 43.9%; master’s degree, 31%; high school; 15.4%; Ph.D./doctoral degree, 5.8%; grade school, 1.3%; not applicable, 2.6%.
To calculate the global score and the scales score, the sum of all item ratings was used. The scoring scale was ranged as, Almost never (definitely no): 1 point; Very rarely/Once in a while: 2 points; Occasionally/Seldom: 3 points; Quite often/Sometimes: 4 points; Very frequently/Usually: 5 points; Almost always (definitely yes): 6 points.
Descriptive Statistics (n = 2,266)
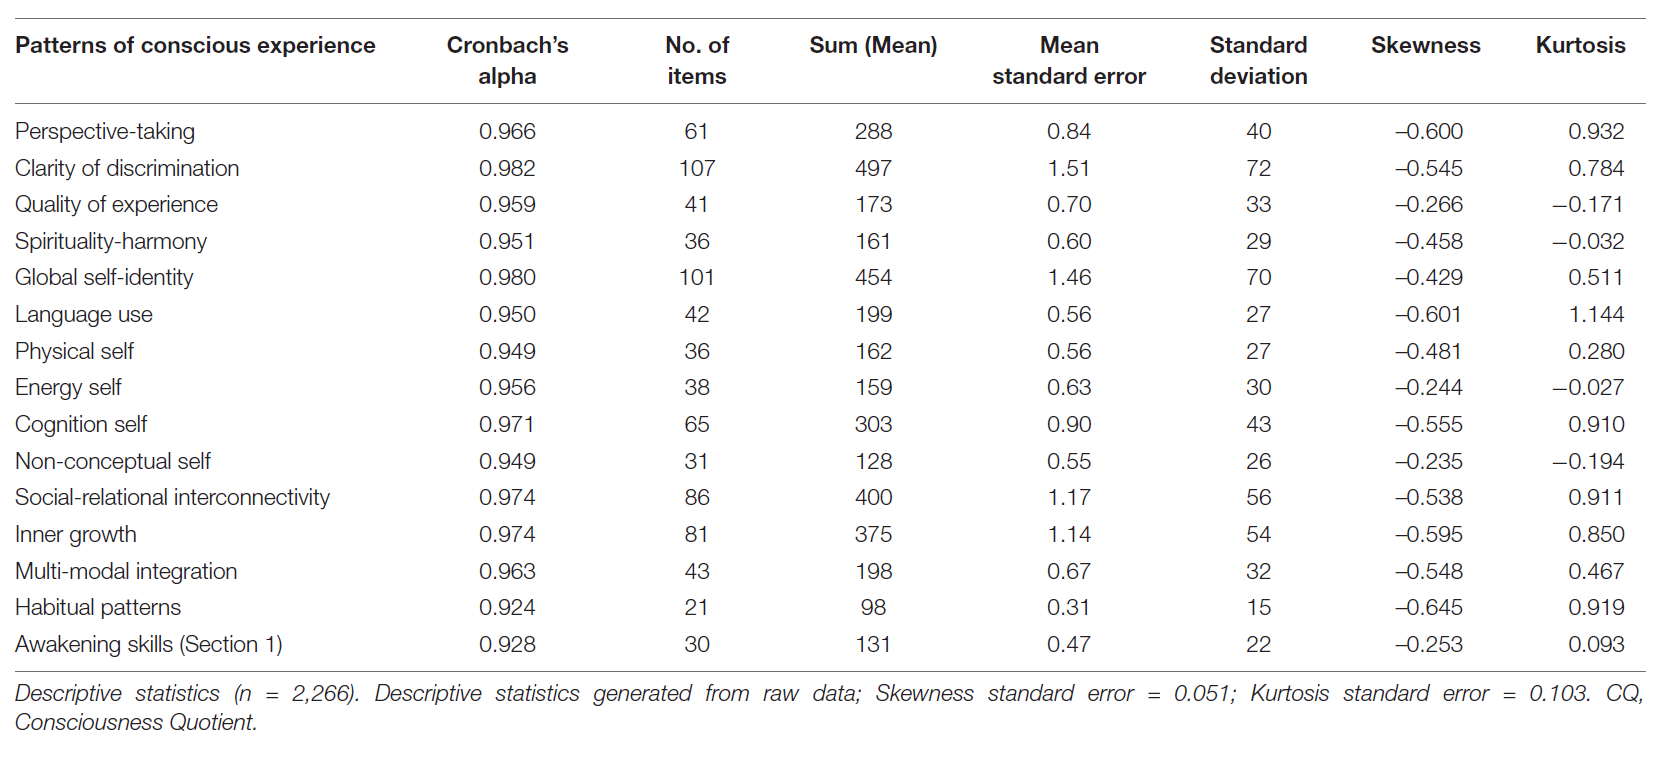
For the entire questionnaire with 237 items, reliability analysis revealed a very good internal consistency: Cronbach’s α = .989, McDonald’s ω = .990. The descriptive statistics for the 15 patterns of conscious experience are provided below.
For the total score, the Kaiser-Meyer-Olkin measure of sampling adequacy (.998) indicated that factor analysis might be useful. Bartlett’s test of sphericity results were also acceptable (approx. chi-square = 321,209.234; df = 27,966). The statistical descriptives for the CQ-i total score were as follows: mean = 1,077.22 (std. error = 3.217); 95% confidence interval for mean: lower bound = 1,070.91, upper bound = 1,083.53; 5% trimmed mean = 1,080.90; median= 1,083.00; variance = 23,453.407; SD = 153.145; minimum = 238, maximum = 1,422; range = 1,184; interquartile range = 210; kurtosis = 0.693 (std. error = 0.103).
CQ-i half-split reliability was tested using Cronbach’s alpha, Spearman-Brown coefficient, and Guttman split-half coefficient. The test items were split in two parts automatically by SPSS. Split-half reliability: Part 1, 119 items, r = .977; Part 2, 118 items, r = .982. Correlation between forms: r = .940. Spearman-Brown coefficient: equal length = .969, unequal length = .969. Guttman split-half coefficient = .969.
Scales data were tested for reliability to determine the possibility to create a modular assessment structure (independent testing for each scale). The result showed that each scale is reliable, with some scales having a larger variability than others. Skewness was calculated for each scale, to check if the scale has a quasi-normal distribution of scores. The kurtosis index was included to explore whether the distribution is too peaked (Hair et al., 2017). The most substantial variability in scores was observed for non-conceptual self, quality of experience, energy self, spirituality-harmony, physical self, and awakening skills. The higher variability of these scales may be owing to the variety of developmental methods available and used worldwide, many of them related to mindfulness, meditation, non-duality movements, or spiritual groups. Skewness showed that only a few scales were slightly skewed and were at the threshold for being considered quasi-normal (skewness > 0.5): habitual patterns, language use, perspective-taking, and inner growth.
The patterns of conscious experience are inter-related, containing overlapping items (an item may belong to more than one scale); thus, the scales are highly correlated.
Score Classification
As the raw score distribution was quasi-normal, we decided to use standardized/transformed scores (transformed z scores, M = 100, SD = 15). The initial classification was split into five-point ranges for a better examination.
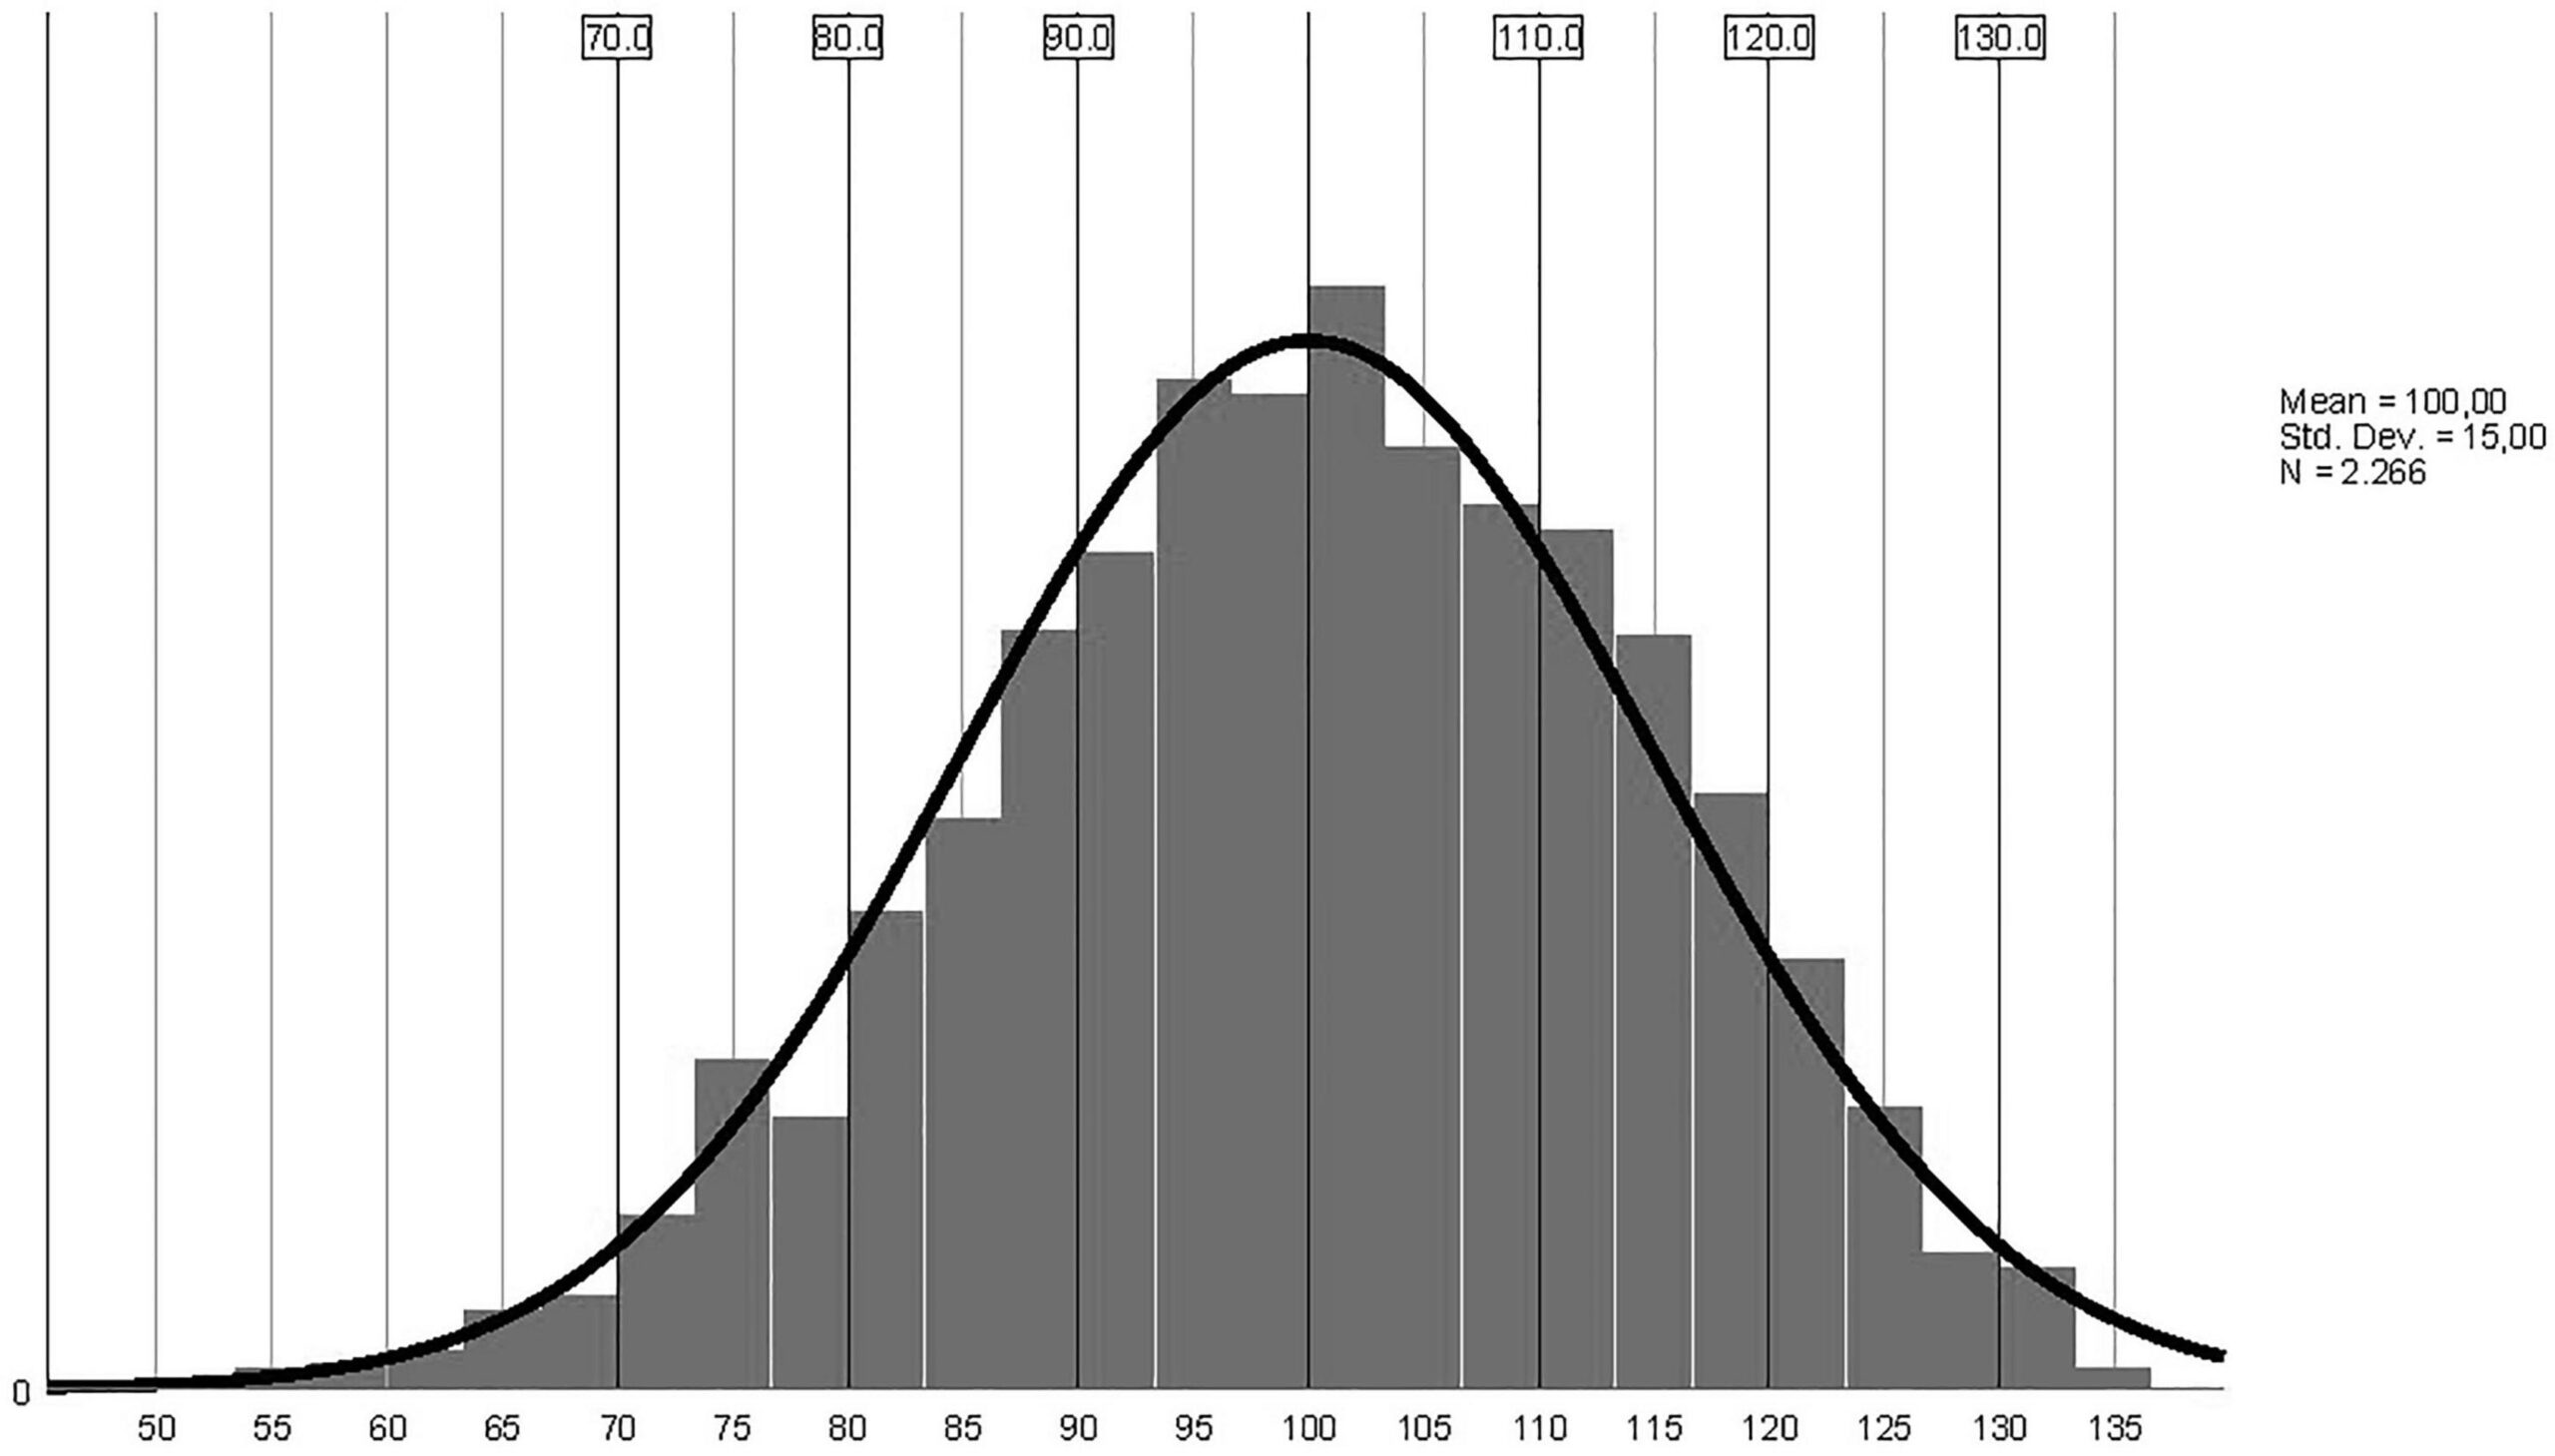
The data for the first and second standard deviations were also used, and the final decision was to use six 10-point intervals, with the average range explored in two intervals: 90-99 and 100-109.
The extreme score intervals were combined for scores below 80 and above 120 (even if the data show there is a statistically relevant granularity) as we wanted to limit the inherent discrimination of people with low scores. CQ-i scores were classified into six intervals with inclusive labels, that were selected to reflect the evolution in the capacity for being conscious.

We limited the number of score categories for practical purposes so that the test-takers would get a meaningful interpretation of their scores. The 6-level classification is the same for the global score and the scales scores.
Future studies on larger samples are necessary for calibrating the cut-offs to more diverse populations.
Reference:
https://www.frontiersin.org/articles/10.3389/fpsyg.2021.634677/full